---
title: "Brazilian Companies"
author: "Ana Luisa Bodevan"
date: "2026-01-27"
categories: ['ribbon', 'economics', 'brazil', 'line chart']
image: "20260127.png"
execute:
warning: false
message: false
format:
html:
code-tools: true
code-fold: true
---
This week challenge dataset in on Brazilian Companies. Check the [TidyTuesday](https://github.com/rfordatascience/tidytuesday/blob/main/data/%7B%7B%20tt_year%20%7D%7D/%7B%7B%20tt_date%20%7D%7D/readme.md) GitHub repo for the data.
## 1. SETUP
```{r}
#| label: load libraries and data
library(pacman)

pacman::p_load(tidytuesdayR, tidyverse, dplyr, janitor,
                ggtext, showtext, glue, ggbranding)

tuesdata <- tidytuesdayR::tt_load('2026-01-27')

companies <- tuesdata$companies |>
  janitor :: clean_names()

rm(tuesdata)
```
## 2. DATA ANALYSIS AND TIDYING
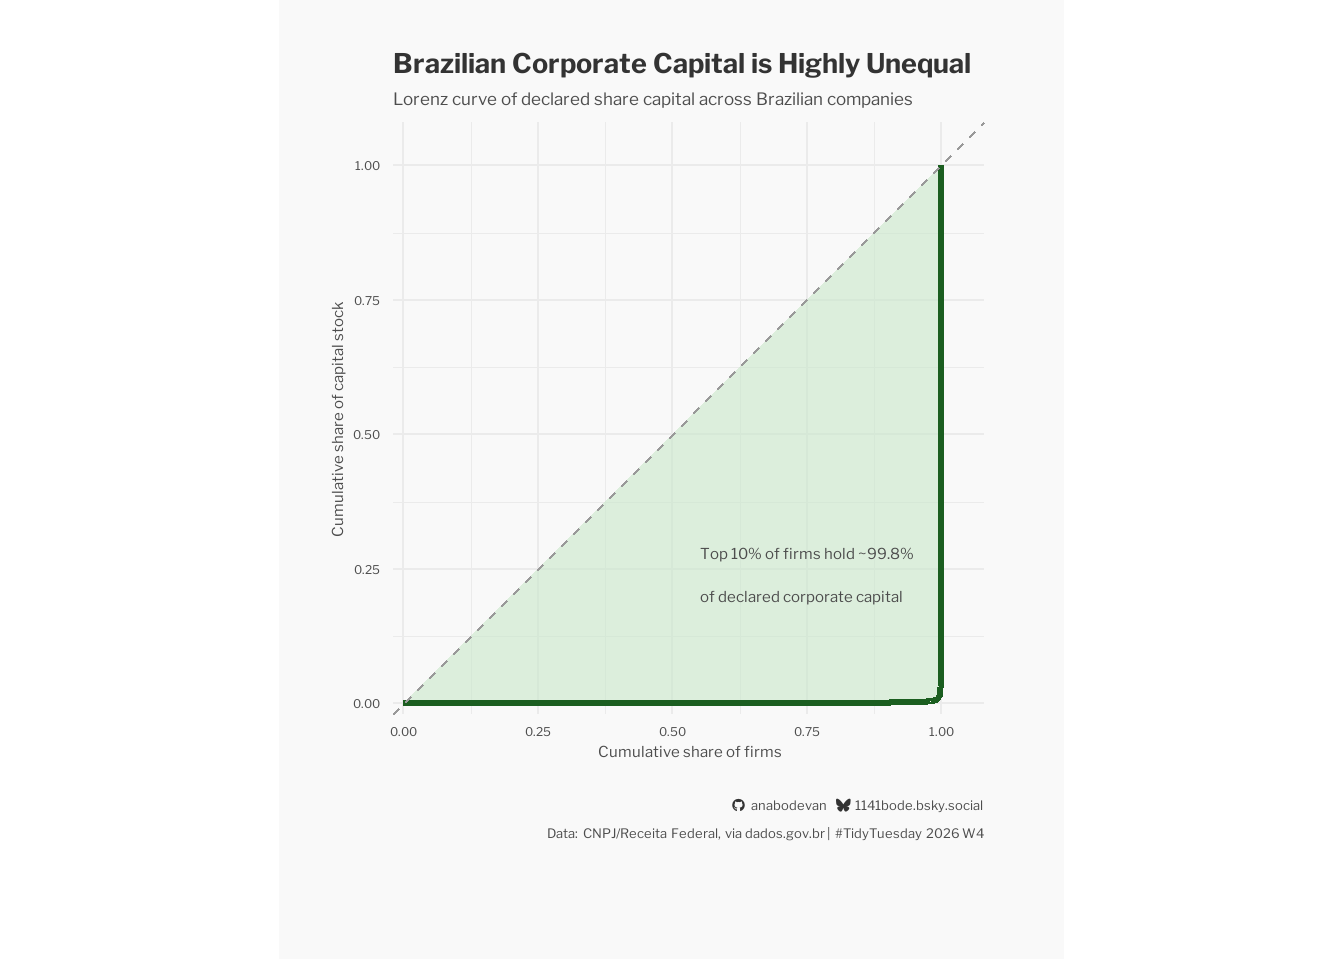
For this week, we will be looking into the GINI index to try to answer how unequal is the distribution of share capital among Brazilian firms.
```{r}
#| label: examine the data
library(ineq)

companies_clean <- companies |>
  filter(capital_stock > 0)

gini_overall <- ineq(companies_clean$capital_stock, type = "Gini")

gini_by_size <- companies_clean |>
  group_by(company_size) |>
  summarise(
    gini = ineq(capital_stock, type = "Gini"),
    n_firms = n(),
    .groups = "drop"
  )

gini_overall
gini_by_size
```
Nearly perfectly unequal.
```{r}
lorenz_obj <- Lc(companies_clean$capital_stock)

lorenz_df <- tibble(
  firm_share = lorenz_obj$p,
  capital_share = lorenz_obj$L
)

# Capital share held by top 10% of firms
top_10_capital <- 1 -
  lorenz_df$capital_share[
    which.min(abs(lorenz_df$firm_share - 0.9))
  ]
```
## 3. PLOT
```{r}
#| label: fonts, texts, and colors
background_col <- "#f9f9f9" #"#FDFDFD",  #"#f5f5f2"
title_col <- "gray20"
subtitle_col <- "gray30"
text_col <- "gray30"

# col <- c("name1" = "color1", "name2" = "color2")

font_add_google("Libre Franklin", "libre")

showtext_auto()

title <- "Brazilian Corporate Capital is Highly Unequal"
subtitle <- "Lorenz curve of declared share capital across Brazilian companies"

title_font <- "libre"
body_font <- "libre"

brand <- add_branding(
  github = "anabodevan",
  bluesky = "1141bode.bsky.social",
  text_size = "13pt",
  icon_size = "13pt",
  text_color = "black",
  icon_color = "black",
  line_spacing = 2L,
  text_position = "after",
  additional_text = "Data: CNPJ/Receita Federal, via dados.gov.br\n#TidyTuesday 2026 W4",
  additional_text_size = "10pt",
  additional_text_color = "black",
  text_family = body_font)
```
```{r}
#| label: final plot
library(grid)

ggplot(lorenz_df, aes(x = firm_share, y = capital_share)) +
  # Inequality area
  geom_ribbon(
    aes(ymin = firm_share, ymax = capital_share),
    fill = "#C8E6C9",
    alpha = 0.6
  ) +
  # Lorenz curve
  geom_line(linewidth = 1.2, color = "#1B5E20") +
  # Equality line
  geom_abline(
    intercept = 0,
    slope = 1,
    linetype = "dashed",
    color = "gray60"
  ) +

  # Annotation explaining inequality
  annotate(
    "text",
    x = 0.55,
    y = 0.24,
    label = glue(
      "Top 10% of firms hold ~{round(top_10_capital * 100, 1)}%\n",
      "of declared corporate capital"
    ),
    family = body_font,
    size = 4,
    color = text_col,
    hjust = 0
  ) +

  labs(
    title = title,
    subtitle = subtitle,
    x = "Cumulative share of firms",
    y = "Cumulative share of capital stock"
  ) +

  coord_equal(clip = "off") +
  scale_x_continuous(expand = expansion(mult = c(0.02, 0.08))) +
  scale_y_continuous(expand = expansion(mult = c(0.02, 0.08))) +

  theme_minimal(base_family = body_font) +
  theme(
    plot.background = element_rect(fill = background_col, color = NA),
    panel.background = element_rect(fill = background_col, color = NA),
    plot.title = element_text(
      family = title_font,
      color = title_col,
      face = "bold",
      size = 20
    ),
    plot.subtitle = element_text(
      family = body_font,
      color = subtitle_col,
      size = 13
    ),
    axis.text = element_text(color = text_col),
    axis.title = element_text(color = text_col),
    plot.margin = margin(t = 20, r = 30, b = 40, l = 20)
  ) +

  add_branding(
    github = "anabodevan",
    bluesky = "1141bode.bsky.social",
    text_size = "10pt",
    icon_size = "10pt",
    text_color = "gray30",
    icon_color = "gray20",
    line_spacing = 1L,
    text_position = "after",
    additional_text = "Data: CNPJ/Receita Federal, via dados.gov.br | #TidyTuesday 2026 W4",
    additional_text_size = "10pt",
    additional_text_color = "gray30",
    text_family = body_font,
    caption_halign = 1,
    caption_margin = margin(t = 15, b = 5)
  )
```