---
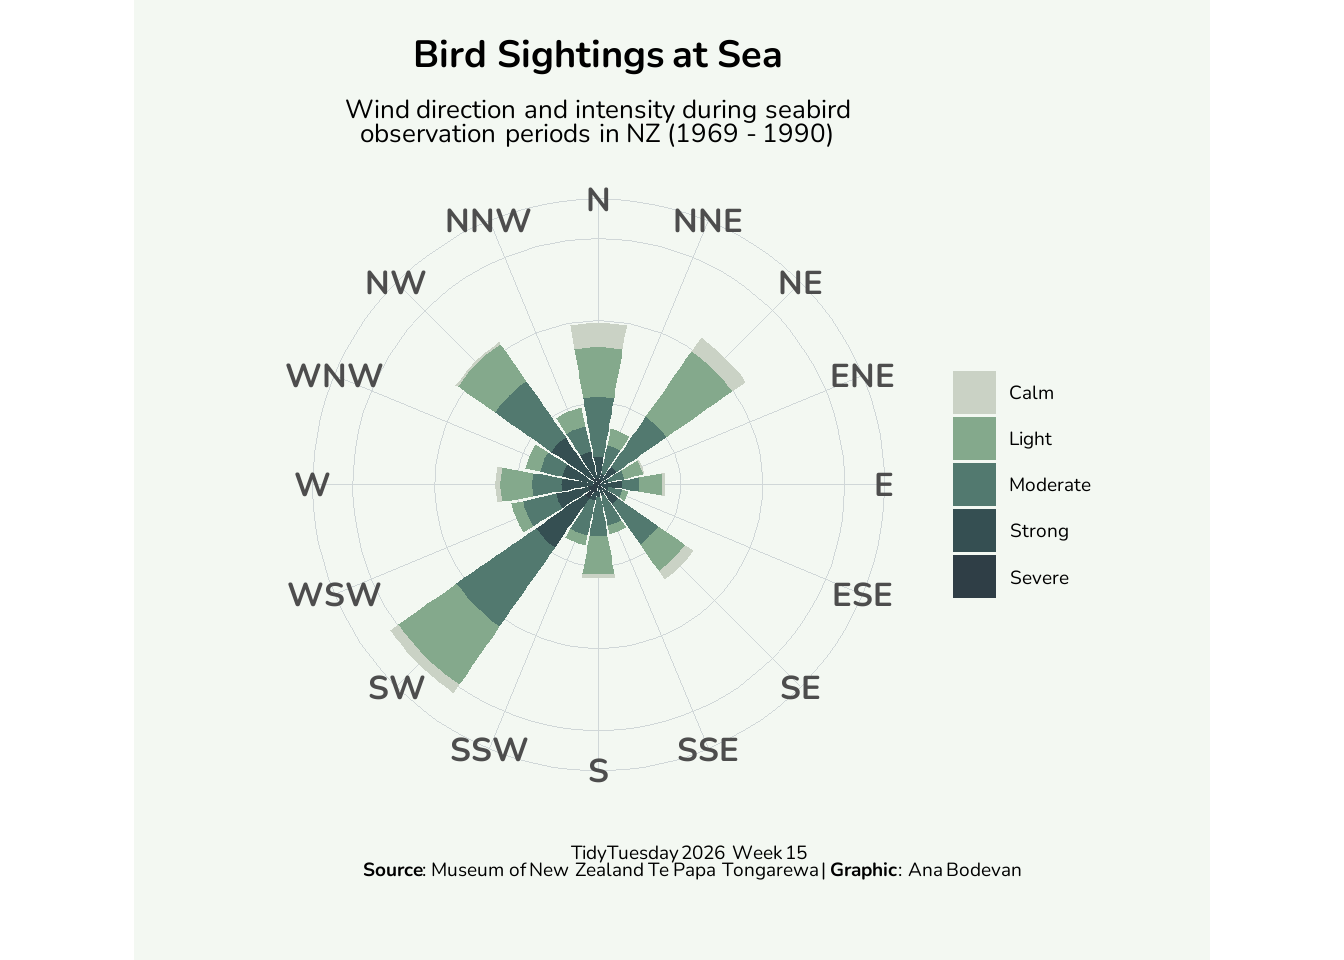
title: "Bird Sightings at Sea"
author: "Ana Luisa Bodevan"
date: "2026-04-14"
categories: ['nature', 'fauna', 'pollar chart', 'column chart']
image: "20260414.png"
execute:
warning: false
message: false
format:
html:
code-tools: true
code-fold: true
---
This week challenge dataset in on Bird Sightings at Sea. Check the [TidyTuesday](https://github.com/rfordatascience/tidytuesday/blob/main/data/%7B%7B%20tt_year%20%7D%7D/%7B%7B%20tt_date%20%7D%7D/readme.md) GitHub repo for the data.
## 1. SETUP
```{r}
#| label: load libraries and data
library(pacman)

pacman::p_load(
  tidytuesdayR,
  tidyverse,
  dplyr,
  janitor,
  scales,
  ggtext,
  showtext,
  glue,
  ggview
)

tuesdata <- tidytuesdayR::tt_load('2026-04-14')

beaufort_scale <- tuesdata$beaufort_scale |>
  janitor::clean_names()

ships <- tuesdata$ships |>
  janitor :: clean_names()

rm(tuesdata)
```
## 2. DATA ANALYSIS AND TIDYING
```{r}
#| label: examine the data
wind <- ships %>%
  left_join(beaufort_scale, by = "wind_speed_class") %>%
  filter(!is.na(wind_direction), !is.na(wind_speed_class)) %>%
  mutate(
    wind_description = fct_reorder(
      case_when(
        wind_description %in% c("calm", "light air") ~ "Calm",
        wind_description %in% c("light breeze", "gentle breeze") ~ "Light",
        wind_description %in% c("moderate breeze", "fresh breeze") ~ "Moderate",
        wind_description %in% c("strong breeze", "near gale") ~ "Strong",
        wind_description %in%
          c(
            "gale",
            "strong gale",
            "storm",
            "violent storm",
            "hurricane"
          ) ~ "Severe",
        TRUE ~ NA_character_
      ),
      wind_speed_class
    ),
    # Shift by 11.25 degrees so North is centered
    dir_binned = cut(
      (wind_direction + 11.25) %% 360,
      breaks = seq(0, 360, by = 22.5),
      labels = c(
        "N",
        "NNE",
        "NE",
        "ENE",
        "E",
        "ESE",
        "SE",
        "SSE",
        "S",
        "SSW",
        "SW",
        "WSW",
        "W",
        "WNW",
        "NW",
        "NNW"
      ),
      include.lowest = TRUE
    )
  )

summary_data <- wind %>%
  count(dir_binned, wind_description) %>%
  mutate(
    pct_total = n / sum(n) * 100
  )
```
## 3. PLOT
```{r}
#| label: fonts, texts, and colors
## colors

background_col <- "#f3f8f2" #FDFDFD",  #"#f5f5f2"
title_col <- "gray20"
subtitle_col <- "gray30"
text_col <- "gray30"

col <- c(
  "Calm" = "#cad2c5",
  "Light" = "#84a98c",
  "Moderate" = "#52796f",
  "Strong" = "#354f52",
  "Severe" = "#2f3e46"
)

## fonts

font_add_google("Nunito", "nunito")
showtext_auto()
showtext_opts(dpi = 300)

# title_font <- ""
# body_font <- ""

## text

title <- "**Bird Sightings at Sea**"
subtitle <- "Wind direction and intensity during seabird observation periods in NZ (1969 - 1990)"
caption <-
  "TidyTuesday 2026 Week 15 <br> **Source**: Museum of New Zealand Te Papa Tongarewa | **Graphic**: Ana Bodevan"
```
```{r}
#| label: final plot
ggplot(
  summary_data,
  aes(x = dir_binned, y = pct_total, fill = wind_description)
) +
  geom_col() +

  # Allow full use of space
  coord_polar(start = -pi / 16, clip = "off") +

  scale_fill_manual(
    values = col
  ) +

  labs(
    title = title,
    subtitle = subtitle,
    caption = caption
  ) +

  theme_minimal(base_family = "nunito", base_size = 9) +

  theme(
    # Layout
    plot.title.position = "panel",
    plot.caption.position = "plot",
    plot.margin = margin(t = 10, r = 40, b = 10, l = 55),

    plot.title = ggtext::element_textbox_simple(
      size = rel(1),
      family = "nunito",
      halign = 0.5,
      width = unit(1, "npc"),
      margin = margin(t = 5, b = 8)
    ),

    plot.subtitle = ggtext::element_textbox_simple(
      size = rel(0.7),
      halign = 0.5,
      width = unit(0.9, "npc"),
      margin = margin(t = 6, b = 12)
    ),

    # Caption
    plot.caption = ggtext::element_textbox_simple(
      size = rel(0.5),
      halign = 0.5,
      margin = margin(t = 10, b = 20)
    ),

    # Background
    plot.background = element_rect(
      fill = background_col,
      colour = background_col
    ),
    panel.background = element_rect(
      fill = background_col,
      colour = background_col
    ),

    # Axis
    axis.text.y = element_blank(),
    axis.text.x = element_text(size = rel(1.1), face = "bold"),
    axis.title = element_blank(),

    # Legend
    legend.position = "right",
    legend.direction = "vertical",
    legend.title = element_blank(),
    legend.text = element_text(size = rel(0.5)),

    # Gridlines
    panel.grid.major = element_line(
      color = "#D0D7D8",
      linewidth = 0.075
    )
  )
```